IGEE
IGEE
Articles
- Page Path
- HOME > IGEE Proc > Volume 3(2); 2026 > Article
-
Article
Narrowing the Attitude-Behavior Gap: EcoStep, a Mobile Application for Plastic Reduction Using Visualization, Gamification, and Personalization† - Il Song1, Wonhee Jeong2
-
IGEE Proc 2026;3(2):100-106.
DOI: https://doi.org/10.69841/igee.2026.014
Published online: June 29, 2026
1School of Business, Yonsei University, Seoul, Korea
2School of Business, College of Computing, Department of Computer Science and Engineering, Yonsei University, Seoul, Korea
- *Corresponding author: Il Song, E-mail: songil04@yonsei.ac.kr
- †This article was supported by the IGEE Social Engagement Fund 2025. The contents were developed as part of an undergraduate educational initiative and are presented for educational and internal academic reporting purposes only.
© 2026 by the authors.
Submitted for possible open-access publication under the terms and conditions of the Creative Commons Attribution (CC BY) license (http://creativecommons.org/licenses/by/4.0/).
- 2,252 Views
- 235 Download

Abstract
- Plastic pollution, especially microplastics, has emerged as a serious environmental problem. However, the attitude-behavior gap, in which high awareness does not translate into action, has been noted as a barrier to sustainable consumption, and a regulation-centered approach alone appears to have difficulty driving voluntary individual behavior change. In response, this study developed EcoStep, a mobile application combining visualization, gamification, and personalization to help convert awareness into action, and examined its effects on practice frequency and response efficacy. Using a mixed methods design, the 20-day study drew on usage logs from 29 app users, end-of-study survey responses from 14 of them, and in-depth face-to-face interviews with 5 participants. A retrospective pre-post survey on a 5-point scale measured severity awareness, practice frequency, response efficacy, feature ratings, and intention to use. Plastic reduction was calculated through conservative conversion to prevent overestimation, and the quantitative data were analyzed using descriptive statistics. The 29 participants recorded a total plastic reduction of 7 kg. Practice frequency rose from an average of 2.29 to 3.71, narrowing the attitude-behavior gap from 1.57 to 0.14, and response efficacy from 2.86 to 3.64. Ratings of the main features were generally positive, and about 80% of participants indicated an intention to continue using and recommend the app. These results suggest that concrete, measurable feedback and motivational elements can help narrow the attitude-behavior gap, and that digital interventions can complement regulation-centered policy to support voluntary pro-environmental behavior. This study also relates to Sustainable Development Goals (SDGs) 12, 13, and 14.
- Plastic has greatly increased the convenience of modern society, but at the same time it acts as a factor causing serious environmental pollution. In particular, microplastics, which are 5 mm or smaller, are difficult to identify with the naked eye, so it appears that the general public has difficulty fully recognizing their existence and severity. According to an international collaborative study led by the 5 Gyres Institute, an estimated 171 trillion microplastic particles, weighing about 2.3 million tons, are present in the world's oceans (Eriksen et al., 2023). The rate of increase in microplastics has also been reported to be accelerating since 2005 (Eriksen et al., 2023). These microplastics are presumed to be transferred through the food chain to higher-level predators and ultimately into the human body. In fact, microplastics have been reported in the blood of 17 of 22 adults (about 77%) (Leslie et al., 2022). In addition, the possibility has been raised that plants absorb airborne microplastics and provide a pathway for them to reach the human body (Li et al., 2025).
- The international community has recognized the severity of the problem and has responded with various policies (United Nations, 2022). However, because these approaches focus mainly on regulation and prohibition, they appear to have limitations in eliciting voluntary and sustained behavior change at the individual level. Prior research points out that even when awareness of environmental problems is high, it does not immediately translate into action, a phenomenon known as the attitude-behavior gap, which acts as a major barrier to sustainable consumption (Wintschnig, 2021). Meanwhile, it has also been reported that pro-environmental behavior can be promoted when the environmental consequences of one's own behavior are presented visibly (Luo et al., 2022). These findings suggest the possibility that visible feedback may contribute to narrowing the attitude-behavior gap.
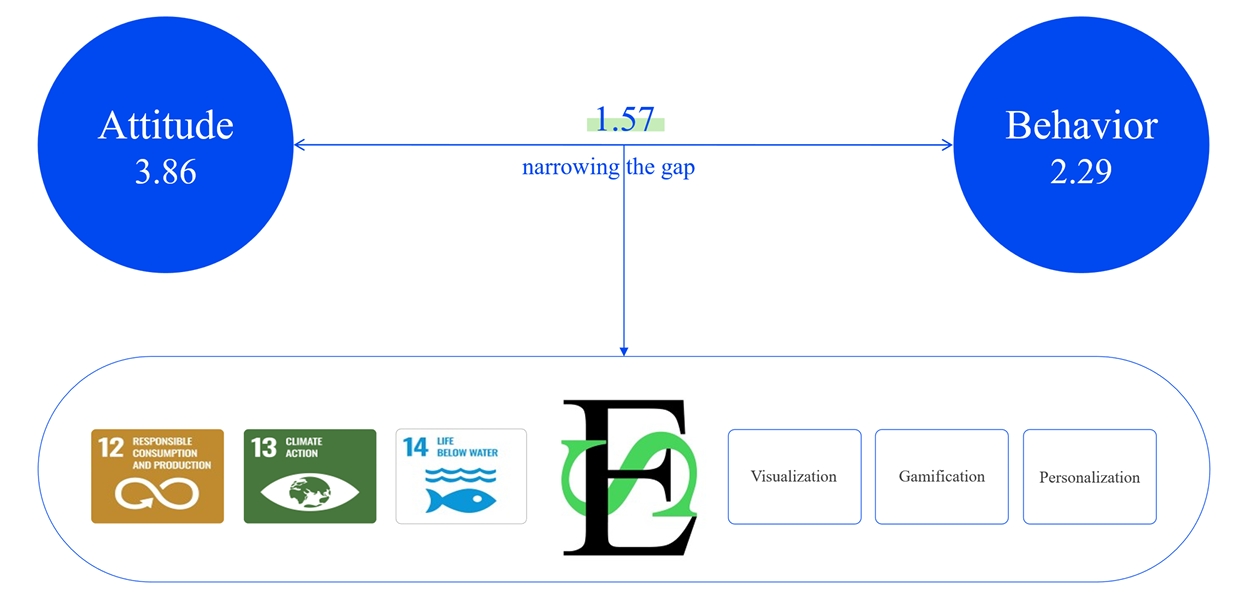
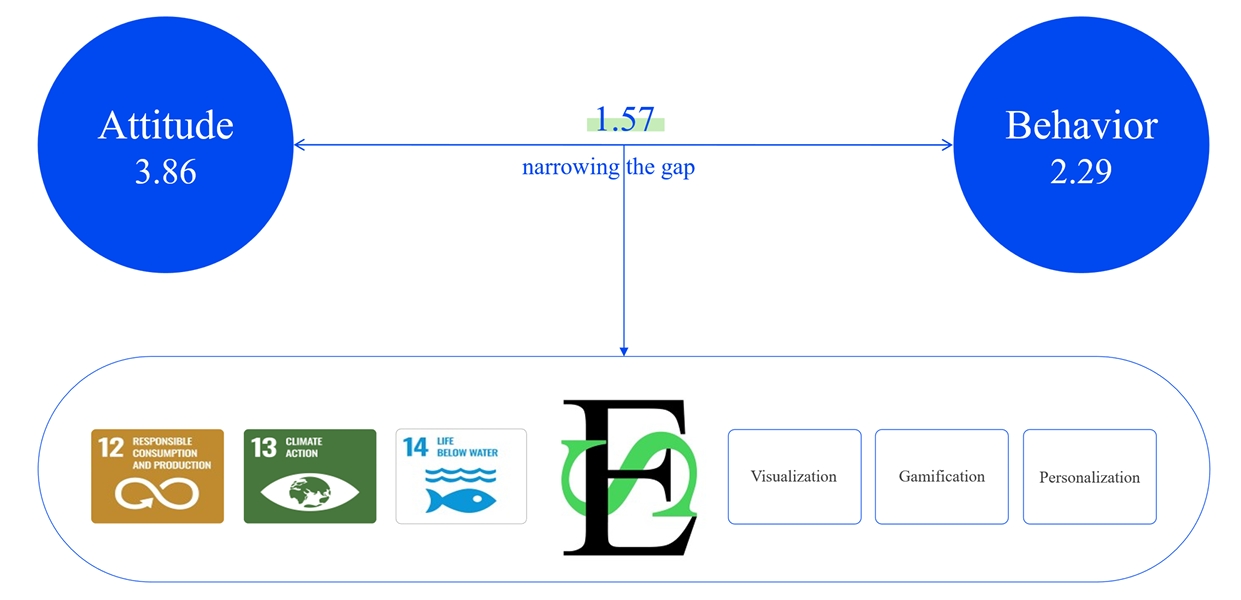
- Building on this concern, this study aims to develop a mobile application that helps young adults take action to reduce plastic use in daily life, and to examine its effects. To convert awareness into action, the application adopted three design principles. First, visualization that presents reduction outcomes visibly was intended to let users immediately confirm the results of their actions. Second, gamification elements were intended to provide ongoing motivation to participate. Third, personalized challenges were intended to increase the likelihood of taking action. The conceptual structure of this approach is presented in Figure 1.
- The aims of this study relate to the Sustainable Development Goals (SDGs), specifically Responsible Consumption and Production (SDG 12), Climate Action (SDG 13), and Life Below Water (SDG 14). In particular, the study aligns with Target 14.1 of SDG 14, which aims to prevent and reduce marine pollution of all kinds (United Nations, 2025).
- Accordingly, this study sought to test the following hypotheses. First, use of the application is expected to increase the practice frequency of environment-related activities and, as a result, to reduce the gap between awareness and action (H1). Second, use of the application is expected to increase response efficacy, that is, the belief that one's own pro-environmental behavior can contribute to solving the problem (H2). In addition, the gamification and visualization elements are expected to contribute to users' motivation to act. The validity of these expectations was examined using both quantitative and qualitative data. Specific results are presented in the following sections.
1. Introduction
- Materials
- EcoStep, the application used in this study, was developed over about five months (August to December 2025) based on an initial prototype built in June 2025. After internal testing and preliminary validation from October to December 2025, it was officially released on the iOS and Android platforms in December.
- The application used React (19.2.1) and Vite (7.2.4) for the frontend and Tailwind CSS (3.4.17) for styling, and it used Supabase (supabase-js 2.57.4) for the database and authentication (Google, Kakao, and Apple OAuth). The iOS and Android builds were configured with Capacitor (7.4.3). The Anthropic Claude API (Anthropic SDK 0.60.0, claude-3-haiku-20240307 model) was used for the chatbot, for providing environmental information, and for estimating the weight of unregistered items. The Naver Maps API (v3) was used for location-based store guidance, and the Kakao JavaScript SDK was used for KakaoTalk sharing.
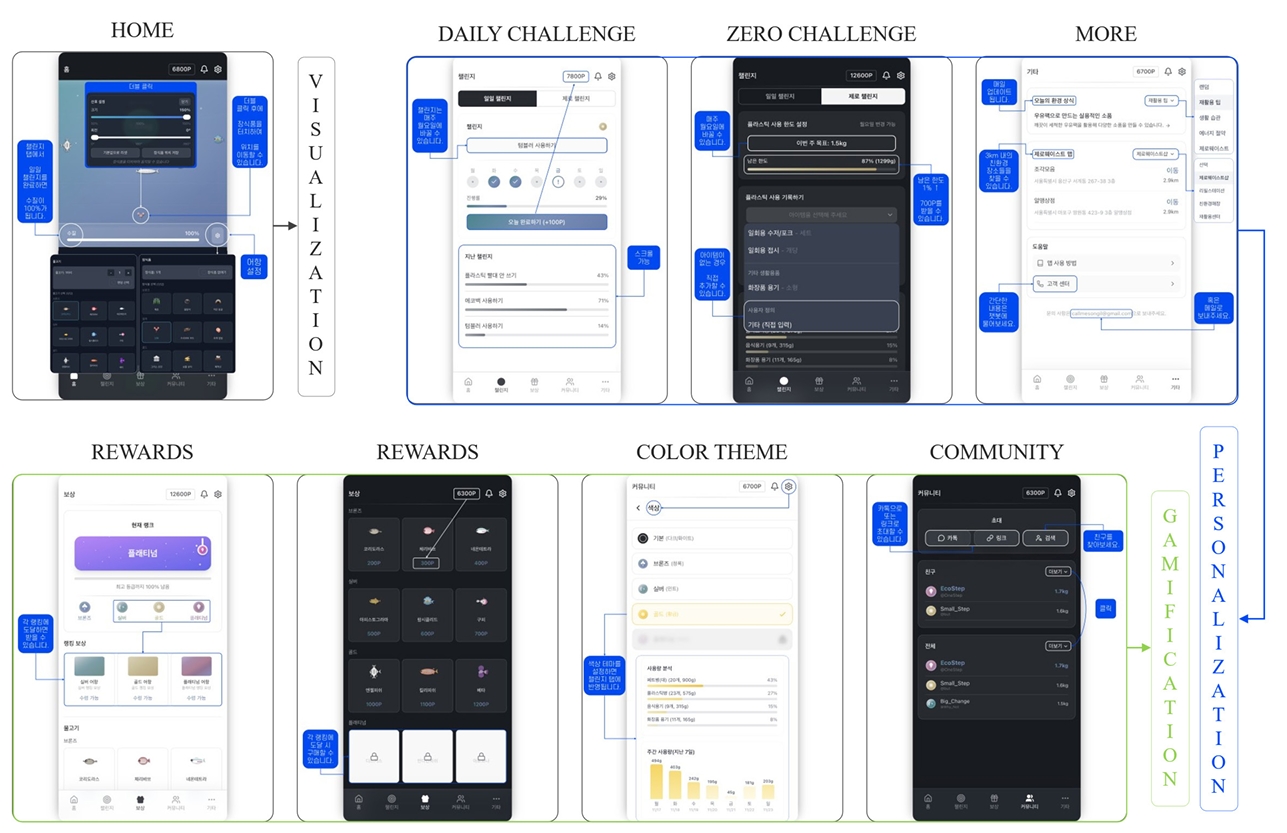
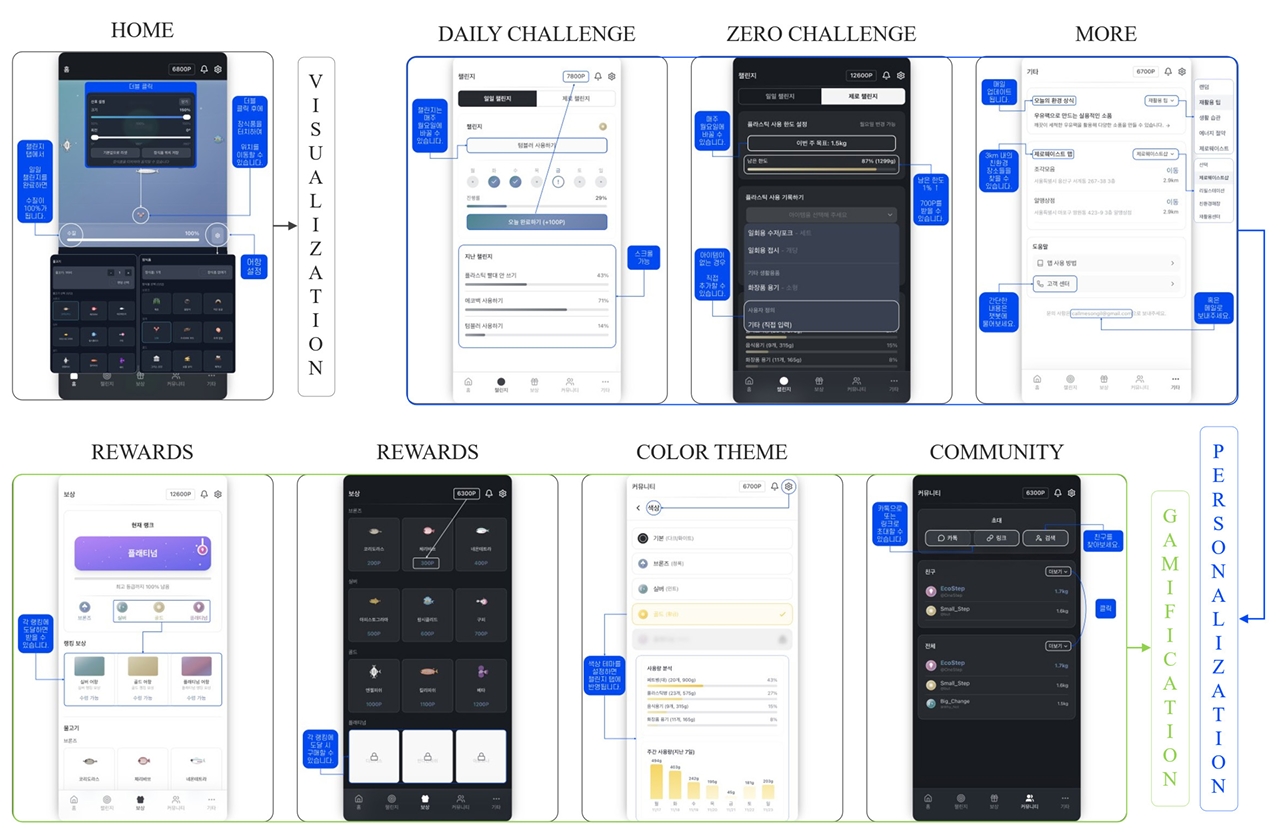
- Guided by the goal of converting awareness into action, the application mapped the three design principles of visualization, gamification, and personalization onto its features (Figure 2).
- First, the visualization principle was implemented through a virtual ocean aquarium and a water-quality system on the home screen. If a user does not complete challenges, the aquarium gradually becomes murky, and when challenges are completed, the water quality recovers and becomes clear. This allows users to indirectly observe the impact of their actions on the marine environment. In addition, the cumulative amount reduced is presented as statistics, along with concrete figures such as "○○g saved."
- Second, the gamification principle was implemented through points, a reward system, rankings, and community features. Each time users record a reduction, they earn points and can collect rewards (12 types of fish, 4 ranks, 12 decorations, and 4 backgrounds). In addition, through rankings and community features (inviting friends and sharing reduction amounts), users experience that taking action is not a solitary activity.
- Third, the personalization principle was implemented through customized challenges and location-based guidance. In the Daily Challenge, users directly select the items they will act on, and in the Zero Challenge, users set their own plastic-use limits and record them so that they can view their usage habits as a graph. In addition, through the Zero-Waste Map, information on eco-friendly stores within a 3 km radius of the user's location (20 stores in Seoul) was provided through integration with Naver Maps.
- The amount of plastic reduced was calculated conservatively to ensure measurement integrity. When a user recorded a reduced item, it was converted into weight according to a predefined per-item weight conversion table (Table 1). Items not registered in the conversion table were estimated using the Claude API. The conversion values were set low to prevent overestimation.
- Methods
- Participants. Study participants were recruited on a voluntary basis. Data were collected from application usage logs (29 participants), an end-of-study survey (14 participants), and in-depth interviews (5 participants). Both the survey and the interviews were conducted with subsets of the 29 people who used the app. The survey was conducted by email using Google Forms. All participants took part voluntarily and consented by responding to the survey and participating in the interviews. Demographic information was obtained only for the 14 survey respondents, not for the 29 participants with usage logs. Because participants were recruited voluntarily, it is possible that the sample included a relatively large number of users who are interested in environmental issues. This limitation is discussed in Section 4.
- Measures. Data were collected through three channels. First, the cumulative amount of plastic reduced, converted according to the per-item weight conversion table (Table 1), was collected from the application usage logs. Second, on a 5-point scale (1 to 5), the survey measured severity awareness of the plastic problem, the practice frequency of environment-related activities (e.g., using a reusable cup or tumbler, using a reusable shopping bag, and separating recyclables), response efficacy related to pro-environmental behavior, the reasons that hindered practice, feature-by-feature ratings, and intention to continue using and to recommend the app. Explicit anchors were provided for the 1 and 5 points of each item (for example, for practice frequency, 1 = "never" and 5 = "every day"). Third, face-to-face semi-structured in-depth interviews were conducted with 5 participants to collect feedback on which features helped with behavior change and which aspects needed improvement. When presenting qualitative data, responses from open-ended survey items and from the in-depth interviews (5 participants) were distinguished by source.
- Study model. This study adopted a mixed methods approach that combines quantitative investigation and qualitative analysis. The study proceeded in the following order: defining the problem through a literature review and data analysis, then completing and stabilizing the core features based on the prototype, then conducting a user study with the completed application (January 3 to January 23, 2026, over 20 days), and finally performing quantitative and qualitative analysis. The survey was administered once, at the end of the study. The pre-use state was measured through a retrospective pre-post design, in which participants reported on their earlier state from memory. The limitations of this design (such as the possibility of recall bias) are discussed in Section 4. The conceptual structure of the study approach is presented in Figure 1.
- Analysis. The quantitative data were analyzed with descriptive statistics (means, percentages, and the percentage of responses rating 4 or higher) using Microsoft Excel. The attitude-behavior gap was defined as the severity awareness score minus the practice frequency score. Means are reported to two decimal places, but differences and gaps were calculated using the pre-rounding means. The qualitative data were summarized thematically.
2. Materials and Methods
- The survey respondents were 14 of the 29 app users. Their age distribution was 10 in their 20s and 30s (71.4%) and 4 in their 40s and 50s (28.6%), and all 14 reported that they had no prior experience using environment-related apps other than this application. In what follows, the amount of plastic reduced is reported for all 29 participants whose usage logs were aggregated, while survey-based indicators are reported for the 14 respondents.
- Analysis of the application usage logs showed that the total amount of plastic reduced recorded by the 29 participants over 20 days (January 3 to January 23, 2026) was observed to be 7 kg (rounded down). This value is an observed value calculated according to the predefined conservative weight conversion table.
- Before using the app, participants' severity awareness of the plastic problem averaged 3.86 (on a 5-point scale), a relatively high level. In contrast, the practice frequency of environment-related activities averaged only 2.29, so a gap of 1.57 points was observed between severity awareness and action. After using the app, practice frequency increased to an average of 3.71. As a result, the attitude-behavior gap narrowed to 0.14 points (Table 2). In addition, the number of participants practicing environment-related activities at least three times a week (rating 4 or higher) increased from 1 (7.1%) before using the app to 7 (50.0%) after using it. These results are consistent with the hypothesis (H1) that app use would increase practice frequency and narrow the attitude-behavior gap.
- The background to the low level of practice before app use is partly reflected in the responses about reasons for hindered practice. Of the 14 participants, 11 responded to the item asking why they had not practiced environment-related activities (multiple responses allowed). "Not knowing the effect" was the most common, cited by 11 (100%), followed by "not knowing what to do" by 6 (54.5%), "finding it bothersome" by 6 (54.5%), "a sense of doing it alone" by 5 (45.5%), and other by 1 (9.1%).
- Response efficacy, the belief that pro-environmental behavior can contribute to solving the problem, rose from an average of 2.86 before app use to 3.64 after app use (Table 2). The number of participants rating 4 or higher increased from 2 (14.3%) to 10 (71.4%). These results are consistent with the hypothesis (H2) that app use would increase response efficacy.
- The feature-by-feature ratings and intention to use are presented in Table 3. The motivational effect of the challenge format averaged 4.00 (85.7% rating 4 or higher, 12 people), game elements such as points, rewards, and rankings averaged 4.00 (71.4%, 10 people), and the provision of concrete figures such as "○○g saved" averaged 3.93 (78.6%, 11 people). The intention to continue using in the future averaged 3.93 (78.6%, 11 people) and the intention to recommend averaged 4.07 (78.6%, 11 people), so even after short-term use, about 80% of participants showed an intention to continue using and to recommend the app.
- Responses related to behavior change were also found in the in-depth interviews. One participant said, "It was a topic I had only vaguely thought about, but using the app made it easy to take part through concrete action." Another participant noted that the app helped them act by reminding them of practices they had only thought about and quickly forgotten. These responses suggest the possibility that visible feedback and concrete guidance for action may have contributed to connecting awareness to action. Suggestions for improving and expanding features are discussed together in Section 4.
3. Results
- This study began from the view that individuals' action on environmental problems is constrained not so much by a lack of awareness as by the absence of concrete methods for action, sustained motivation, and visible feedback on the effects of their behavior. This phenomenon, in which action does not follow even when awareness is high, has been discussed in prior research as the attitude-behavior gap (Wintschnig, 2021).
- The findings of this study were in line with this view. Participants' severity awareness of the plastic problem was relatively high at an average of 3.86, but the practice frequency of environment-related activities averaged only 2.29, confirming an attitude-behavior gap of 1.57 points. In addition, "not knowing the effect" was the most frequently cited reason for hindered practice, which suggests that the absence of feedback for confirming the effects of behavior was a major obstacle. In other words, what was lacking appears to have been not awareness but the methods, motivation, and feedback that support action.
- EcoStep was designed to address these deficiencies. Through visualization, it presents the results of behavior visibly. Through gamification, it provides motivation to participate. Through personalization, it makes methods for action concrete. After app use, practice frequency rose to an average of 3.71 and the attitude-behavior gap narrowed to 0.14 points. Response efficacy also rose. These changes are consistent with hypotheses H1 and H2. They are also in line with prior research showing that visible feedback can promote pro-environmental behavior (Luo et al., 2022). However, this study’s design does not allow us to determine whether the change in efficacy mediated the change in practice, so it is difficult to conclude that efficacy is a mediator of behavior change.
- These results suggest that scalable digital interventions that complement policy centered on regulation and prohibition can play some role in encouraging voluntary behavior change at the individual level. The practicality and scalability of this approach are supported by two findings: the challenge, game elements, and provision of concrete figures were all rated relatively highly in the feature-by-feature evaluation, and about 80% of participants showed an intention to continue using and to recommend the app even after short-term use.
- Based on the observed values of this study, the magnitude of the reduction effect can be estimated. Linearly extrapolating the 20-day per-person reduction to an annual basis yields an expected reduction of about 4.41 kg per person per year (equivalent to approximately 294 plastic bottles of 500 ml, based on 15 g per bottle). With a user base of 100, this could lead to a reduction of about 441 kg per year, and with 1,000 users, about 4,410 kg per year. However, because these figures are a linear extrapolation based on the assumption that participants continue to use the app at the same level as during the 20 days, the actual long-term effect needs to be verified through follow-up research.
- This study has the following limitations. First, because the study used a single group without a control group and relied on retrospective reporting of the pre-use state, the possibility of recall bias is difficult to rule out. Second, because the data collection period was short, at 20 days, it was not possible to confirm whether the observed behavior change is sustained as a habit. Third, because participants were recruited voluntarily, the sample may have included a relatively large number of users interested in environmental issues, which limits the generalization of the results to the general public. Fourth, because a research team of two carried out app development, data collection, and analysis together, there were limitations in collecting large-scale data and conducting in-depth analysis. Fifth, because the reduction amounts are based on users' self-reports, there is a possibility of measurement error. However, conservative weight conversion was applied to reduce the possibility of overestimation.
- Considering these limitations, future research should verify whether the behavior is sustained as a habit through pre-post measurement that includes a control group and through longitudinal observation, and should expand the size and age range of the sample. In addition, we plan to improve the app through links with public institutions and recycling facilities, multilingual support, and the expansion of challenges into areas beyond plastic.
- In sum, this study suggests that abstract awareness of environmental problems alone is unlikely to translate into action, but that the attitude-behavior gap can be narrowed when concrete and measurable feedback and motivational elements are provided. In a short-term user study using EcoStep, practice frequency and response efficacy rose in directions consistent with the hypotheses. These results show that digital interventions can serve as a complementary tool for supporting pro-environmental behavior change at the individual level. However, given the constraints of a short-term, single-group, and voluntary sample, the results of this study are preliminary. Confirmation through long-term and controlled follow-up research is needed.
4. Discussion and Conclusions
| Indicator | Before Using App | After Using App | Change |
|---|---|---|---|
| Severity awareness | 3.86 | - | - |
| Practice frequency | 2.29 | 3.71 | 1.43 |
| Attitude-behavior gap | 1.57 | 0.14 | −1.43 |
| Response efficacy | 2.86 | 3.64 | 0.79 |
Values reported by the 14 survey respondents (N = 14). All indicators were measured on a 5-point scale (1 to 5). The pre-use values were reported retrospectively at the end of the study. Severity awareness refers to awareness of the severity of the plastic problem. Practice frequency refers to the degree of practice of environment-related activities (using a reusable cup or tumbler, using a reusable shopping bag, separating recyclables, etc.). Response efficacy refers to the belief that one's own pro-environmental behavior can contribute to solving the plastic problem. The attitude-behavior gap is the severity awareness score minus the practice frequency score. Severity awareness was measured only once, before app use, so no post-use value (-) is reported. Changes and gaps were calculated using pre-rounding means, so they may differ somewhat from calculations based on the rounded values shown in the table.
Ratings by the 14 survey respondents (N = 14). All items were measured on a 5-point scale. The feature-rating items were anchored at 1 = strongly disagree to 5 = strongly agree, and intention to continue using at 1 = not at all to 5 = very much. "Percentage rating 4 or higher" is the percentage of participants who responded with a 4 or a 5. The number in parentheses is the corresponding count.
- Eriksen, M., Cowger, W., Erdle, L. M., Coffin, S., Villarrubia-Gómez, P., Moore, C. J., Carpenter, E. J., Day, R. H., Thiel, M., & Wilcox, C. (2023). A growing plastic smog, now estimated to be over 170 trillion plastic particles afloat in the world's oceans—Urgent solutions required. PLOS ONE, 18(3), Article e0281596. https://doi.org/10.1371/journal.pone.0281596ArticlePubMedPMC
- Leslie, H. A., van Velzen, M. J. M., Brandsma, S. H., Vethaak, A. D., Garcia-Vallejo, J. J., & Lamoree, M. H. (2022). Discovery and quantification of plastic particle pollution in human blood. Environment International, 163, Article 107199. https://doi.org/10.1016/j.envint.2022.107199Article
- Li, Y., Zhang, J., Xu, L., Li, R., Zhang, R., Li, M., Ran, C., Rao, Z., Wei, X., Chen, M., Wang, L., Li, Z., Xue, Y., Peng, C., Liu, C., Sun, H., Xing, B., & Wang, L. (2025). Leaf absorption contributes to accumulation of microplastics in plants. Nature, 641(8063), 666-673. https://doi.org/10.1038/s41586-025-08831-4ArticlePubMed
- Luo, Y., Douglas, J., Pahl, S., & Zhao, J. (2022). Reducing plastic waste by visualizing marine consequences. Environment and Behavior, 54(4), 809-832. https://doi.org/10.1177/00139165221090154Article
- United Nations. (2025). Goal 14: Conserve and sustainably use the oceans, seas and marine resources. Retrieved September 25, 2025, from https://www.un.org/sustainabledevelopment/oceans/
- United Nations. (2022, March 2). Nations sign up to end global scourge of plastic pollution. UN News. https://news.un.org/en/story/2022/03/1113142
- Wintschnig, B. A. (2021). The attitude-behavior gap – Drivers and barriers of sustainable consumption. Junior Management Science, 6(2), 324-346. https://doi.org/10.5282/jums/v6i2pp324-346Article
References
Figure & Data
References
Citations

 PubReader
 Cite
Cite XML Download